Made in Malaysia · Free satellite data · 100+ crop guides · Verification bundles planned


OUR CROPS
Four crops, modelled properly.
Built for flooded paddy, long-lived palms, rubber on a tapping rotation, and pineapple planted in batches—not generic crop models adapted after the fact.
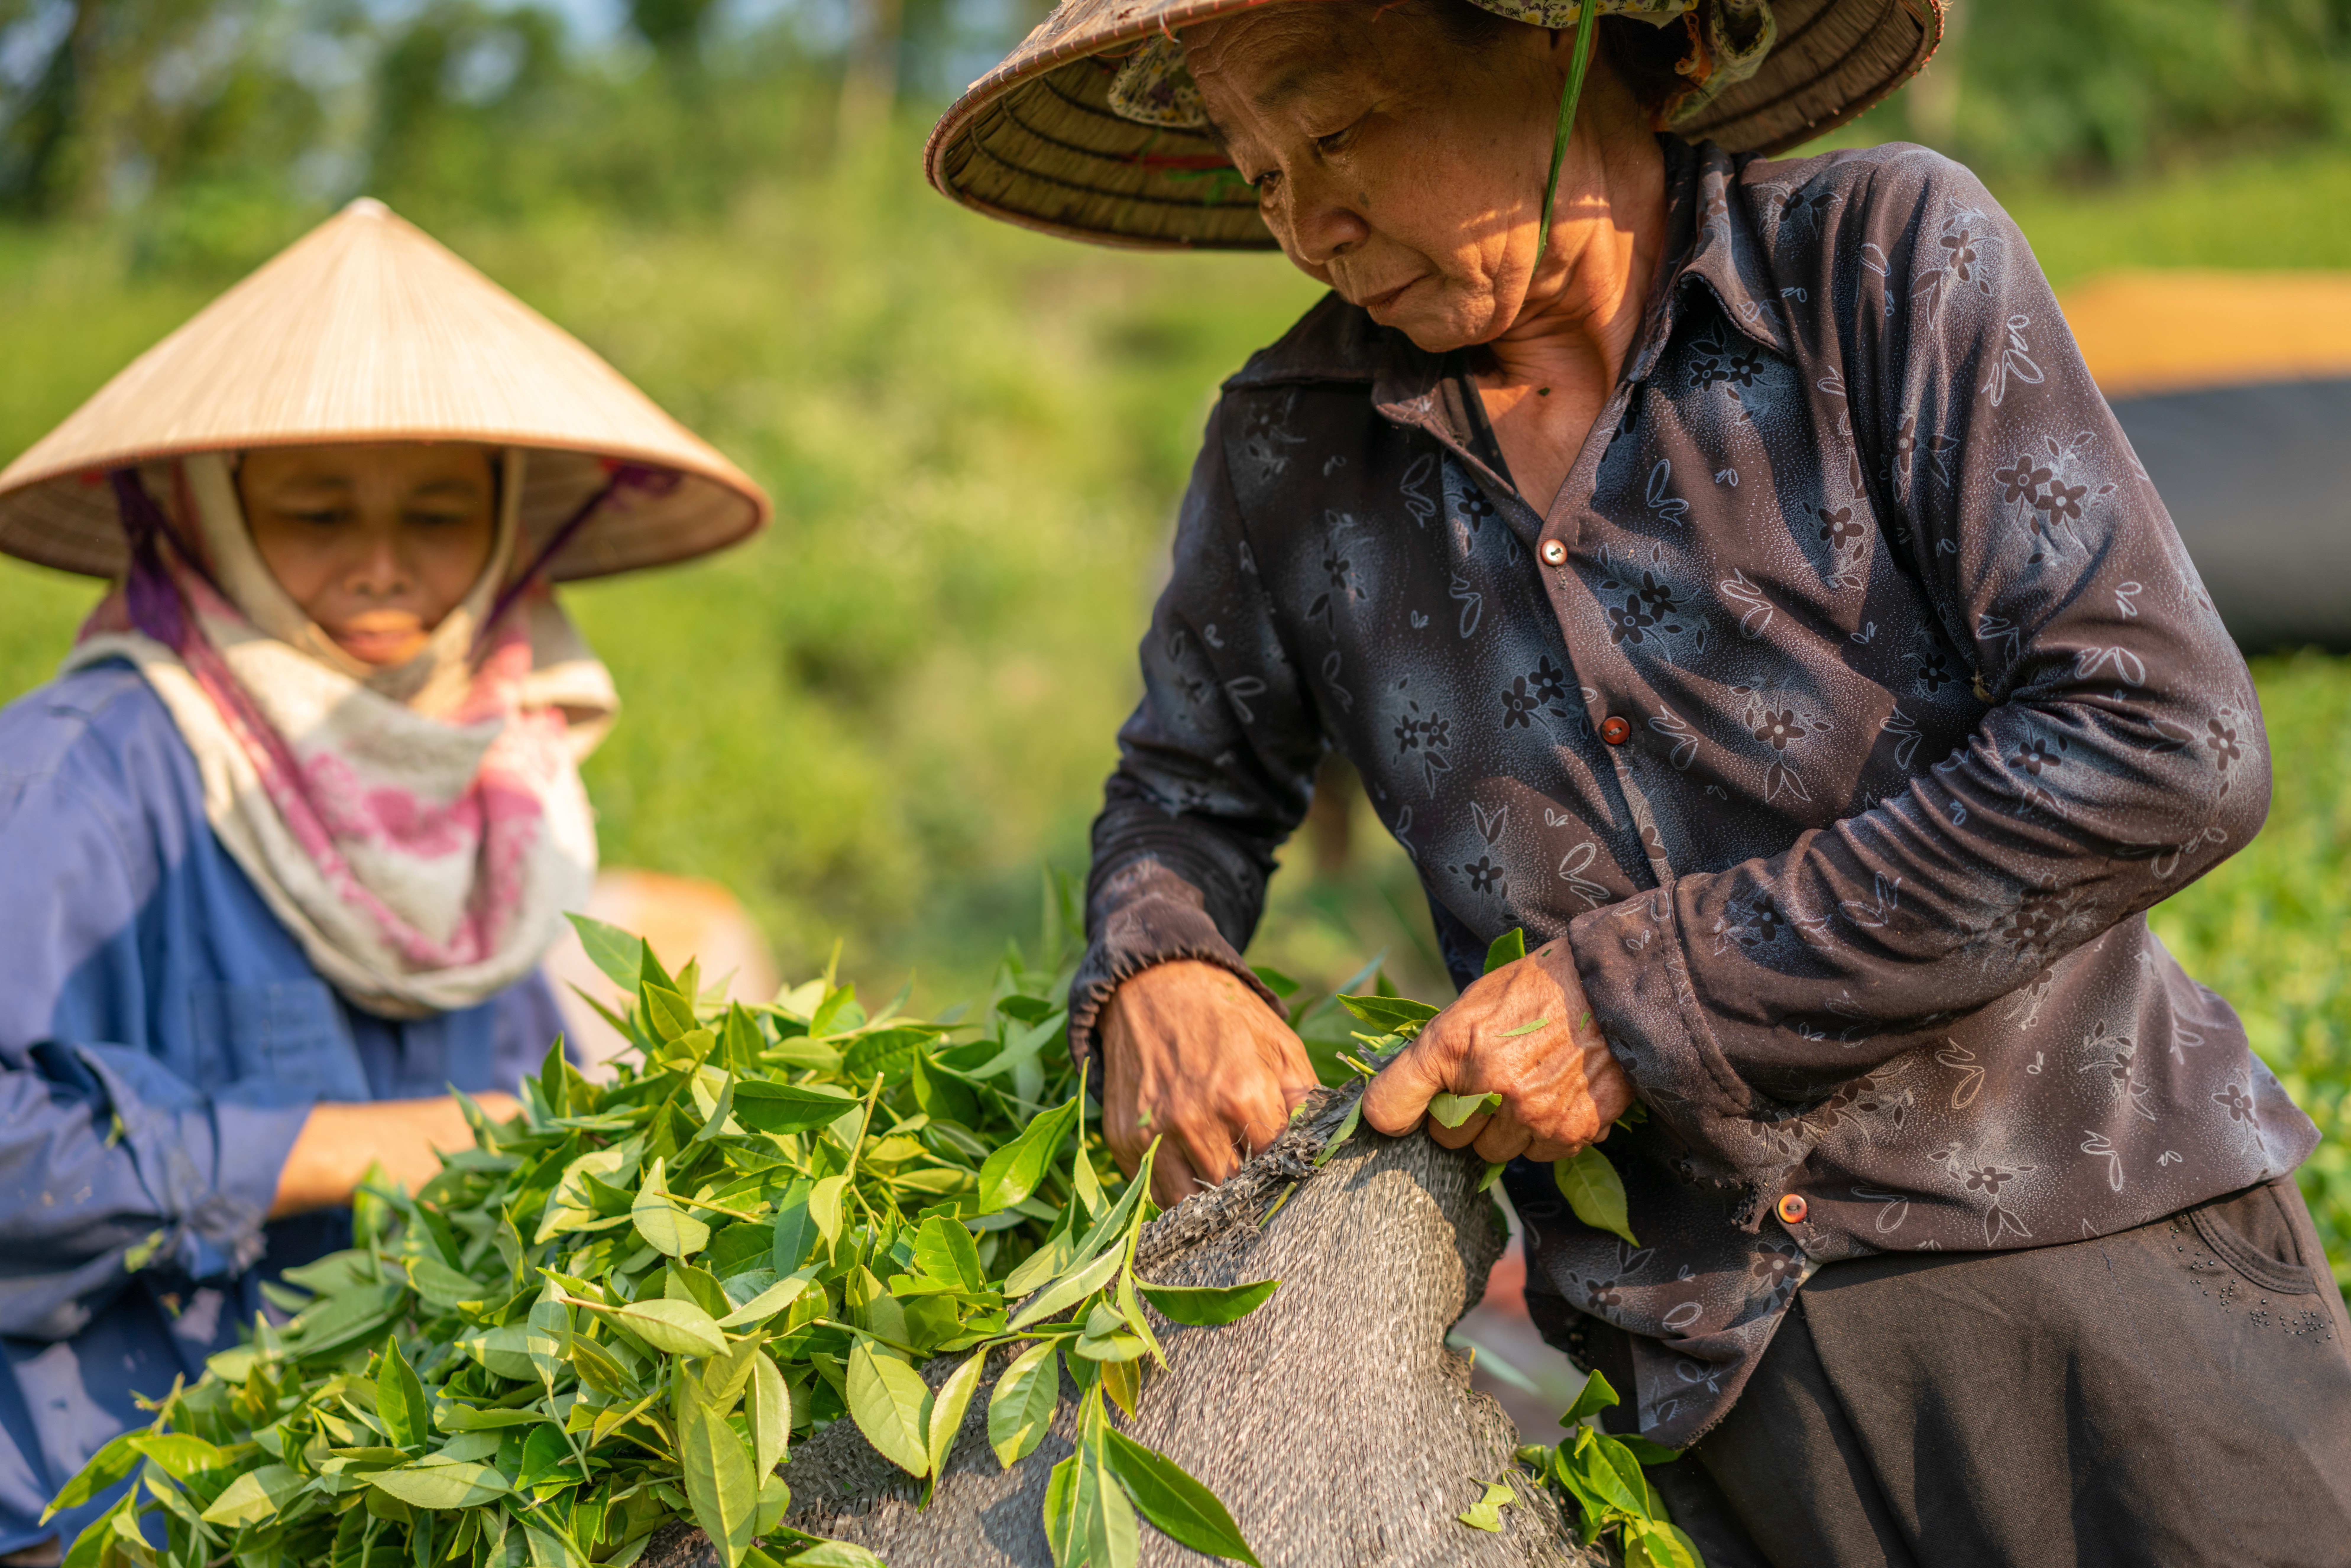
For growers
Know which block needs attention, understand why, and take the next field action with confidence.

For estate teams
Bring field visibility, team coordination and management priorities into one operating rhythm.

For agencies
Monitor patterns across regions, compare outcomes and support programmes with clearer evidence.
HOW IT WORKS
From boundary to proof in four steps.
Every field action becomes a clearer record: what changed, who needs to go, and what you can show later.


INSIDE THE PLATFORM
How SemaiSens turns a satellite pass into a decision you can prove.
Eight stages, in order. Each one hands something to the next, and two of them exist to catch us being wrong.
01
Satellite passes
02
Indices, matched to the crop
03
Rule cards
04
Semai Advisor
05
Scout task and guided route
06
Ground truth closes the loop
07
Verification
08
Region and nation

Satellite passes
Sentinel-2 at 10 m and Landsat at 30 m ingest free and automatically from the day you draw a boundary. A pass every 3 to 7 days. A clouded pass is marked hollow, never quietly skipped.
WHAT CHANGES BY PLAN
Capability
Free
Grower
Estate
Enterprise
Tasks
—
Activity Log
—
National Overview
—
—
VRA Maps
—
—
Verification
—
—
Estate Group
—
—
Regional Forecast
—
—
Carbon (MRV)
—
—
—
INCLUDED IN EVERY PLAN
Imagery & Indices · Dashboard · Trend Analytics · Weather · Alerts · Risk Monitoring · Disaster Impact · Audit Logs · Semai Advisor · Plans · Soil · Market Intel · Yield Prediction · Field Analytics
Prices in MYR and exclude 8% SST · Switch or cancel anytime · Sentinel-2 on every plan, PlanetScope cadence by tier
WHY SEMAISENS
Our Solutions
Published science behind each alert, field checks that improve the system, and planned verification bundles designed for accountable decisions.
01
See risk before it becomes costly
Surface crop stress, water pressure and unusual change patterns while there is still time to act.
02
Turn insight into field-ready work
Route a clear priority to the right person, with location, evidence and a record of what happened next.
03
Build a farm story that improves
Connect monitoring, action and outcomes over time, not just a single dashboard moment.
THE METHOD
Most satellite tools would flag your rubber every February.
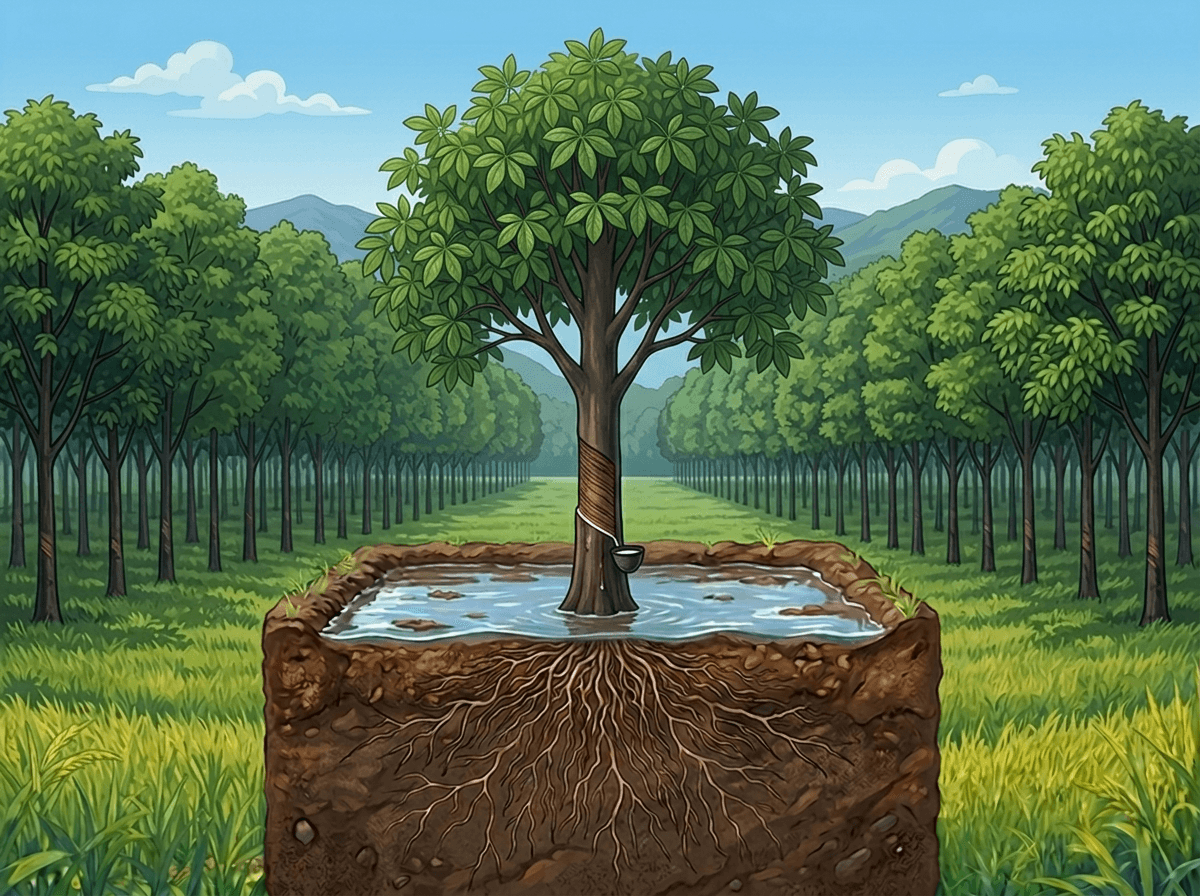
Mature rubber drops its leaves once a year. A tool that does not know this sends your team out to inspect a healthy block every season, until they stop looking. Ours suspends the health band and says nothing. The bands in our documentation are the bands in our software.

Rice
A field still reading heading values at day 110 does not have a better canopy than its neighbours. It has delayed maturity.
29 guides

Oil palm
A drought this month shows up as reduced bunch number and weight up to two years later.
27 guides
Rubber
For six to ten weeks a year, a perfectly healthy tapped block reads below band by design.
24 guides

Pineapple
A block above 0.75 is a scouting prompt, not a clean bill of health.
28 guides
